Introducing the Pipeline-to-Patient Productivity Index (P3i)

R&D spend is up 45% across the top 25 biopharma companies. Pipeline creation is down 32%.

The inaugural P3i reveals who is pulling ahead, who is falling behind, and where your portfolio stands against the benchmarks that matter.

Share:

Download today


The P3i is the first benchmark to follow drug performance across the entire development and commercialization lifecycle. It is made possible by Norstella’s unique position across the pharma value chain. The index is designed to support capital allocation and portfolio decisions across biopharma.

The report spans the top 25 publicly listed biopharmaceutical companies and provides performance benchmarks across eight key indicators. These include early pipeline creation, through clinical development and risk, into market access, and commercial return.

Key Findings from the Inaugural P3i

Eli Lilly tops the inaugural ranking, having risen from what would have been 16th place against the 2020 benchmarks. The report attributes this trajectory to operational improvements across its pipeline, not solely to the success of its GLP-1 franchise. UCB has similarly risen sharply, while several companies have dropped out of the top ten.

  • R&D costs and development timelines are both rising: Pipeline creation has slowed by 32% over the last five years, even as R&D spend increased by 45% across the cohort. The median development timeline has extended from 8.4 to 9.3 years within the same period.
  • Companies are responding through stricter portfolio discipline: Overall success rates have fallen to 8.2% due to a higher Phase I barrier. 38% of clinical failures are now taking place at this early stage, reflecting tighter criteria for advancing into costly late-stage development.
  • Access to new launches is tightening but their commercial impact is rising: One-year coverage stands at 68.3%, in line with the 2020 benchmark, but annual data for 2024 and 2025 suggest a downward trend coinciding with more active payer utilization management such as restrictive prior authorization criteria.
  • Launch performance is improving, but unevenly: Average revenues at seven years post-launch have risen to $1.6bn, driven substantially by GLP-1 therapies. Excluding Wegovy and Mounjaro, the current cohort average falls to $1.3bn – on par with five years ago.
  • Greater scale of launches is required to rejuvenate portfolio mixes: Newly launched products account for 25.7% of total prescription revenues, down from 28.9% in 2020. On current projections, that figure falls to 18% by 2030, pointing to a growing need for deal-making to grow beyond the patent cliff.

2025 R&D vs Commercial Performance within the P3i
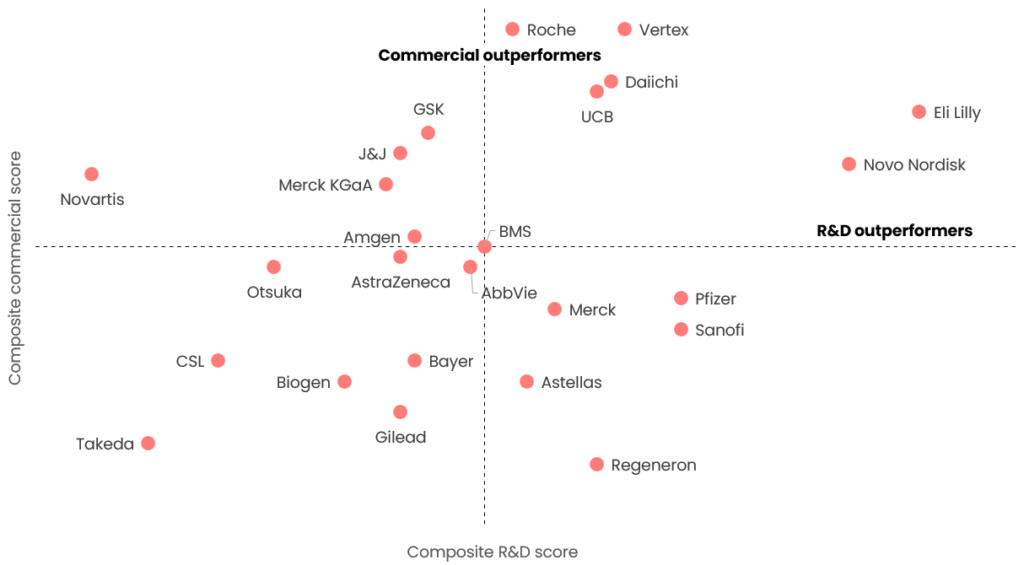
2025 R&D vs Commercial Performance within the P3i

2025 Pipeline-to-Patient Productivity Index Benchmarks

R&D Benchmarks
Metric Value Period
Pipeline Creation $108m per new drug 2021–25
Development Timeline 9.3 years Phase I to approval 2016–25
PTRS 8.2% entering Phase I 2016–25
Early Failures 37.8% discontinued at Phase I 2016–25
Source: Norstella
Commercial Benchmarks
Metric Value Period
Launch Coverage 68.3% at 1 year 2021–25
Quality of Coverage 91.3% with appropriate PA 2021–25
Launch Performance $1,619m revenues after 7 years 2025
Portfolio Replacement 25.7% from products launched in prior 7 years 2025
 

dan-chancellor-hs

Our expert

Daniel Chancellor

VP, Thought Leadership, Norstella

Daniel has more than 15 years of experience in the biopharma industry, spanning roles in drug discovery, market analysis, competitive intelligence, and strategic consulting.

Daniel oversees the thought leadership program for Norstella, producing unique research that guides clients through ever-changing industry dynamics. Daniel regularly participates in webinars and industry conferences, and provides expert insights across a wide range of leading industry and business publications. Prior to joining Norstella, Daniel worked as a medicinal chemist at Summit Therapeutics and graduated with First Class Honors in Natural Sciences from the University of Bath.

Frequently Asked Questions

P3i stands for Pipeline to Patient Productivity Index. It is the first benchmarking index that ranks the top 25 pharmaceutical companies on their productivity across the full drug development lifecycle, from R&D performance through to commercial patient outcomes.

P3i is published by Evaluate, a Norstella company. It is built on proprietary data from three Norstella companies: Evaluate, Citeline, and MMIT.

P3i ranks the top 25 global pharmaceutical companies. Companies were selected based on the scale of their drug development activity and patient reach, using data from across the Norstella group.


P3i measures pharmaceutical productivity across two areas: R&D performance and commercial patient outcomes. It then links these two areas through a single pipeline-to-patient measure, giving each company an overall productivity index score.

Most benchmarking reports cover either R&D or commercial performance, but not both. P3i is the only index that spans the full drug development lifecycle and connects R&D performance directly to patient outcomes in a single measure.

Related Content